After nearly two years as a Research Impact Fellow on tipping points at Exeter University’s Global Systems Institute, I’m pleased to share that I recently started a new job as Lecturer in Geography, Climate Change, & Society at the Sussex University’s School of Global Studies. I’m looking forward to getting stuck in to more teaching on climate change and data analysis, as well as continuing my research on tipping points, resilience, and the Earth system. Stay tuned for further updates!
It’s been a while since I last posted an update here (including that I started working for Uni. Exeter!), but since late 2022 I’ve had some neat new publications out, including co-authoring the Earth Commission’s first major papers in Nature and Lancet Planetary Health, which I led the nutrient cycle aspects of, and leading Section 1 of the Global Tipping Points Report 2023. On the comms side, I’ve been talking to the media a fair bit, including for this (unexpected!) profile on me and my research in El País Semanal, some radio and podcast appearances (including upcoming on Science Vs), and giving comments for various articles, as well as writing for The Conversation a few times and touring my webinar on climate tipping points.
I’ve also continued outreach blogging at climatetippingpoints.info as well as more broadly, and started a new more informal blog on nature, people, and the Earth system at Gaia ex Machina, where I’m hoping to explore some more conceptual territory around how we frame the Earth system and how that affects how we respond to climate change. Freelancing has mostly taken a back seat since returning to full-time jobs at Exeter and now Sussex, but depending on busyness levels I remain available for consulting and writing/speaking gigs on the side via Georesilience Analytics.
We had a new paper out a month ago in Science, in which we reassess climate tipping points based on the past ~15 years of climate science. We conclude that five climate tipping points could already be possible at current warming levels, four of which becoming likely beyond 1.5°C. You can find a free referral link to the final published version over on my publications page (plus links to the accepted version and preprint), and a blogpost explaining the paper over at climatetippingpoints.info.
Summary figure for the paper, showing the climate tipping elements we identify and what global warming level they might tip at
This paper first started out in late 2019 during my last year as a postdoc at Stockholm Resilience Centre on the ERA project, with preliminary results first presented at EGU2020, so I’m really pleased to finally have this out (it’s effectively been my covid project!). It’s also in a way the academic manifestation of my climatetippingpoints.infoscience outreach site, writing for which led me to build up a big database of papers on various climate tipping points which I felt would be useful to bring together in a scientific paper. Along the way I teamed up with Prof. Tim Lenton, who had been planning on such an update of his 2008 paper that kicked off a lot of climate tipping points research, along with various colleagues from Stockholm Resilience Centre and the Earth Commission (who helped fund the latter stages).
Talking about the paper at the Exeter Tipping Points conference
The paper also tied in with the “Tipping Points: from climate crisis to positive transformation” conference in Exeter in mid-September that I was on the programme committee for. We had over 200 delegates attend in-person from across academia, business, policymaking, and social movements (with more online and at the public debate), and had a lot of great insights on topics ranging from the risks from climate tipping points and socio-ecological cascades through to the possibility of triggering ‘positive’ socio-economic tipping points to accelerate decarbonisation. Outputs will be online soon and form the basis of a follow-up working paper and a new annual pre-COP ‘State of Tipping Points’ report.
So it’s been a busy few weeks on climate tipping points, capping off a few years of science synthesis and outreach. Hopefully this paper will serve as a useful reference point, and help show where some of the gaps are that bigger follow-up projects and assessments can tackle.
I’ve got a new paper out at EGU’s Earth System Dynamics this week, looking at the impact of climate change on the biological pump and ocean carbon sink, and in particular the role of ecological complexity in Earth system models in resolving non-linear climate-biosphere feedbacks. This is the first paper out of my recently-completed postdoc at Stockholm Resilience Centre on climate-biosphere feedbacks and tipping points, with a couple more to be submitted soon.
Following up on yesterday’s twitter thread explainer, here’s a blog version explaining what we did and why:
Pump down the Carbon
The oceans act as a massive carbon sink, taking up around a quarter of human CO₂ emissions so far. This CO₂ dissolves in to the surface ocean (making it more acidic in the process) before being transported to the deep ocean where it stays for hundreds of years (the “solubility pump”). Some of this dissolved CO₂ is used by photosynthesising plankton in the surface to make organic matter, which when they poo or die (or are eaten by zooplankton who then do likewise) produces “particulate organic carbon” (POC) which sinks through the ocean as “marine snow”.
As POC sinks it’s mostly consumed by microbes, who respire the organic matter and re-release the carbon & nutrients in dissolved form (known as “remineralisation”). The overall effect is transporting carbon & nutrients from surface to deep waters, i.e. the “biological pump”. Together the solubility and biological pumps transport carbon from the surface to deep ocean, allowing more CO₂ to dissolve in the surface and storing exported carbon in deep waters for hundreds of years before it is eventually mixed back to the surface and re-released.
Rising atmospheric CO₂ means more carbon is now dissolving in surface waters and being exported to deep waters, and so the ocean is acting as a net carbon sink (at least for a few hundred years before that deep water mixes back up).
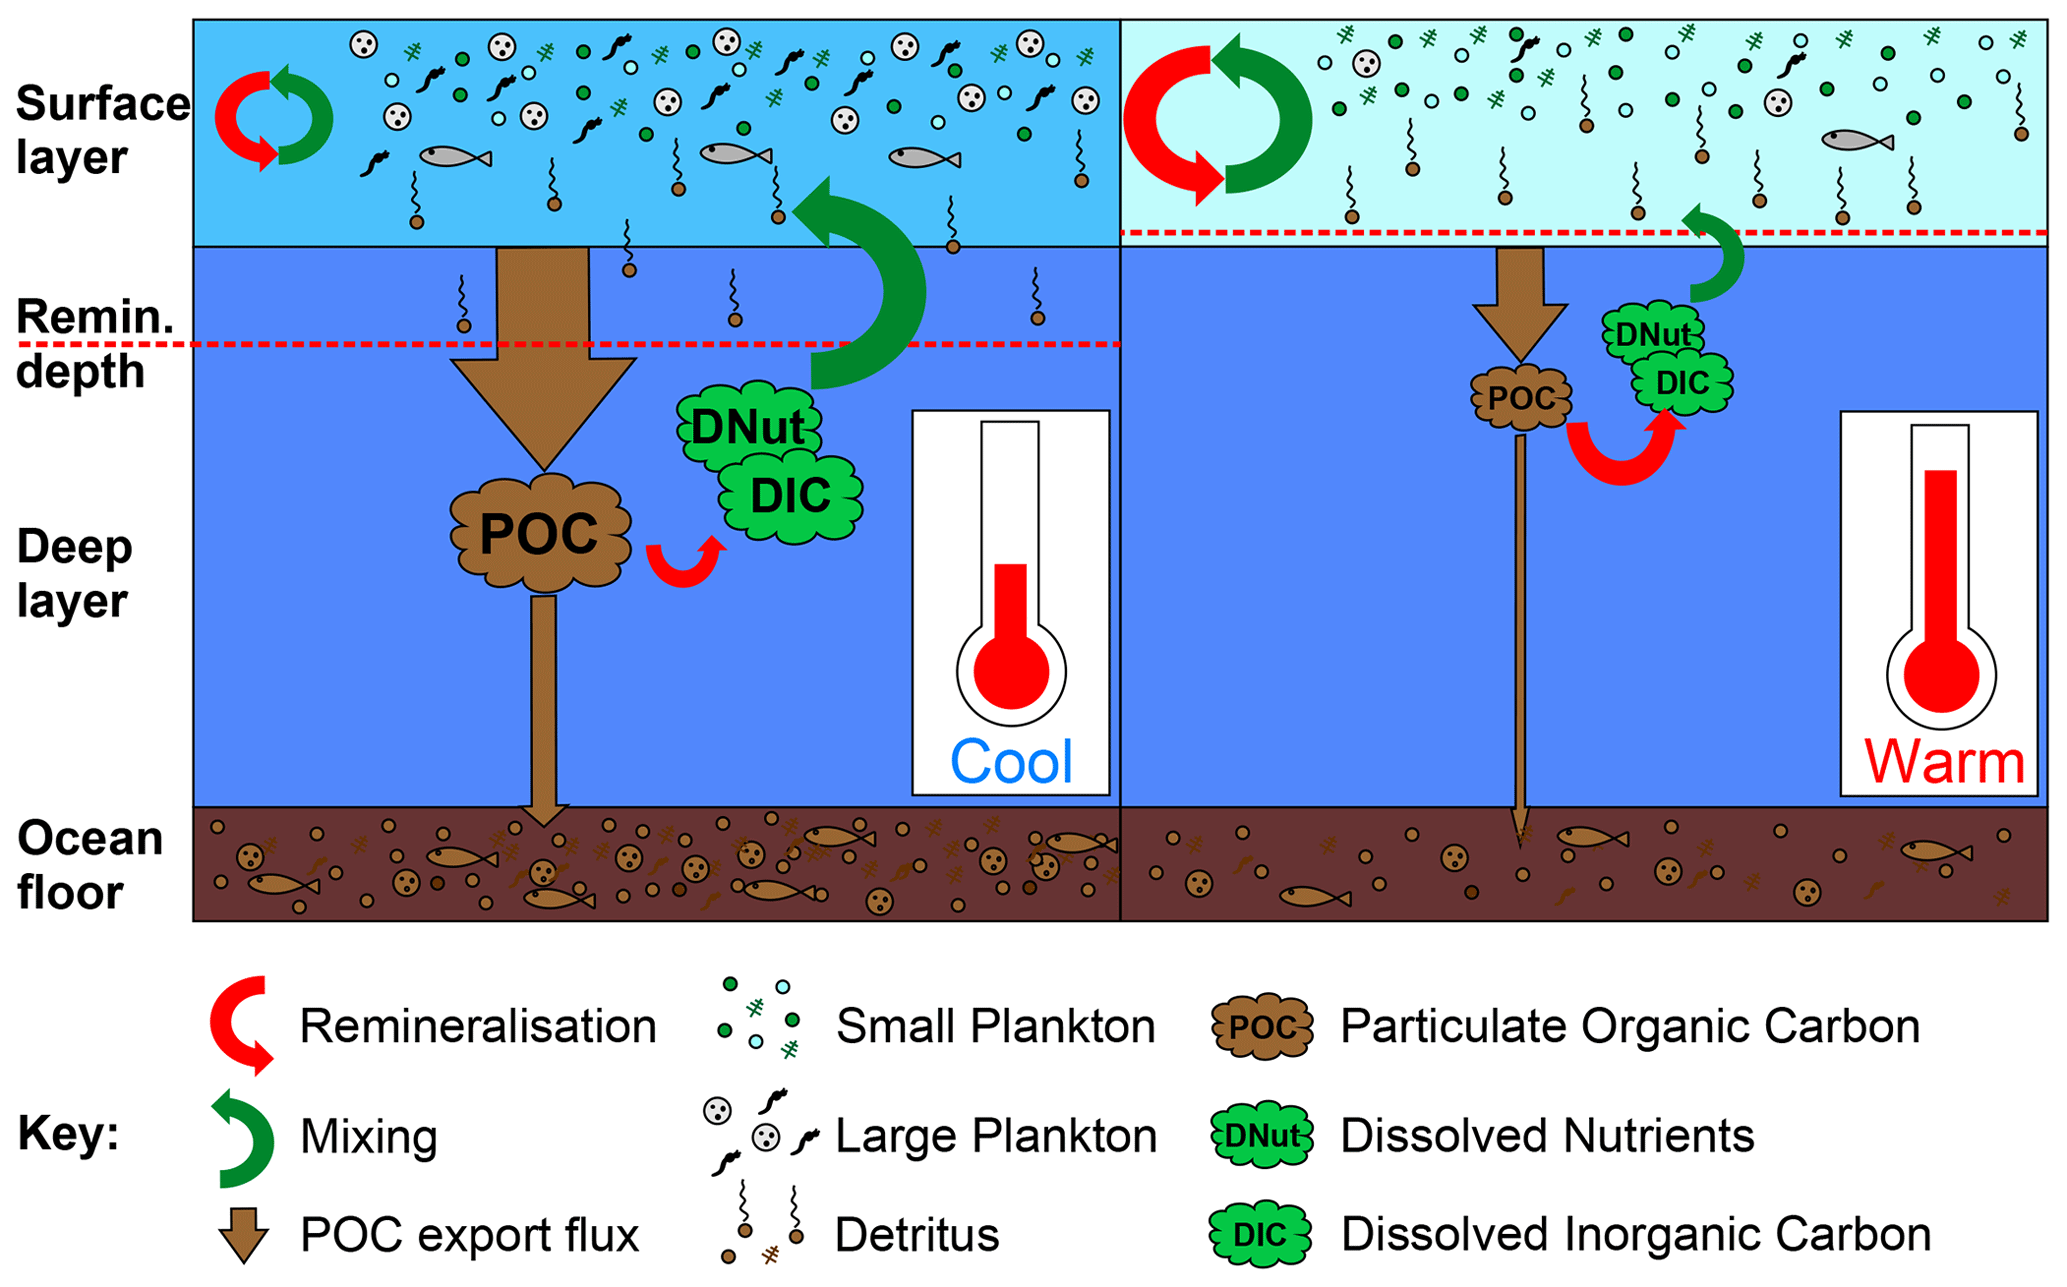
Schematic illustrating the impact of warming on the soft tissue biological pump. On the left-side, under cooler preindustrial conditions the surface layer remains fairly well mixed with the deep ocean (large green arrow from deep to surface layers), returning dissolved nutrients and carbon (DNut & DIC) from the remineralisation of exported POC (red arrow from POC to DIC & DNut), while some POC is remineralised partly within the surface layer. On the right-side, warming leads to a shift to dominance by smaller plankton as well as stratification leading to less mixing between the shallow and deep ocean, while the average remineralisation depth getting shallower leads to greater recycling of nutrients and carbon close to the surface layer, combining to result in an overall reduction in POC export.
But the ocean is also warming up, and this changes the strength of the two pumps. Warmer water holds less dissolved CO₂, limiting the solubility pump. Warming also makes it harder for surface waters to mix with colder deep waters, causing the ocean to stratify and less nutrients to be returned to the surface – conditions that favour smaller phytoplankton. Warming speeds up metabolic rates too, and as respiration increases faster than photosynthesis this means that sinking POC is remineralised – and the carbon and nutrients it contains released – closer to the surface, increasing nutrient recycling but also CO₂ in the surface ocean.
Overall this means we expect both the solubility and biological pumps to weaken with climate change, gradually reducing the capacity of the current ocean carbon sink and the negative climate feedback it provides. However, due to computational limits most Earth system models used to project the future ocean carbon sink don’t resolve key relevant ecological processes such as the effect of warming on remineralisation, plankton size shifts, or plankton adapting to lower nutrient availability.
Ask the eco-Genie
In this study we use ecoGEnIE, a recently developed version of a simpler Earth system model featuring both remineralisation that increases with temperature (“temperature-dependent remineralisation”) and multiple sizes of plankton that can use nutrients flexibly depending on availability (“trait-based ecology”). This allows the effects of ecological dynamics on the biological pump and ocean carbon sink in response to climate change to emerge.
We separate out these effects by turning on temperature-dependent remineralisation (TDR) and trait-based ecology (ECO) (instead of the default simpler FPR & BIO settings respectively) both separately and together, and running ecoGEnIE with future emission scenarios (based on the IPCC’s RCP scenarios, from low [RCP2.6], moderate [RCP4.5], high [RCP6.0], to very high [RCP8.5] emissions) until the year 2500.
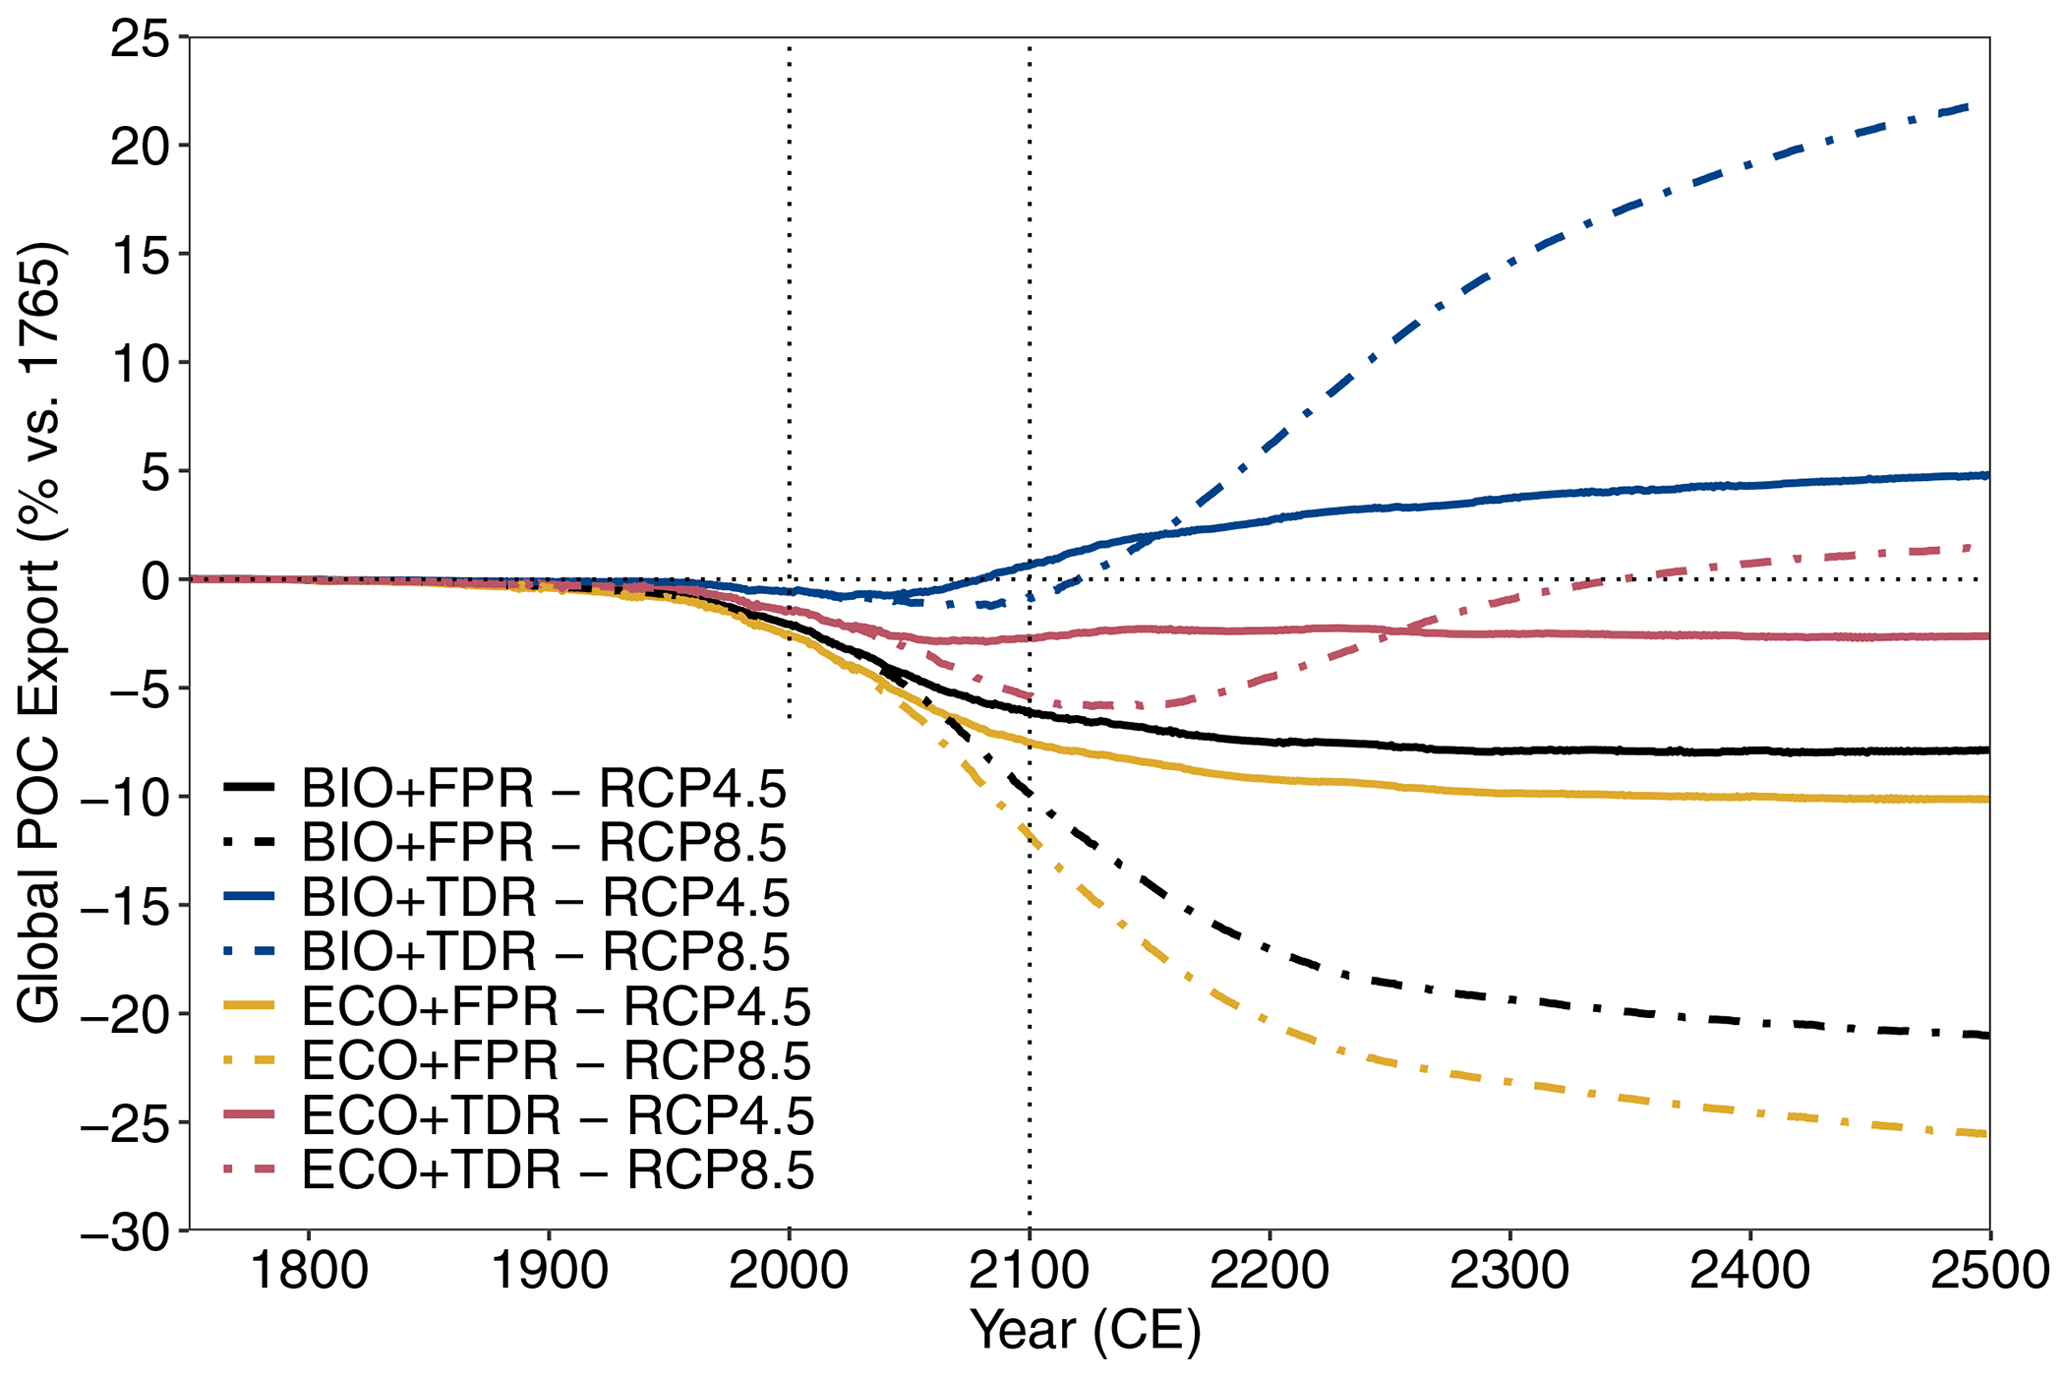
Graph showing ecoGEnIE simulation results for global POC export flux under different configurations and forcing scenarios. As time goes from left to right, going above the zero line means more POC is sinking from the surface ocean around the world, while going below the zero line means less POC is sinking from the surface ocean. Adding TDR (blue) leads to more sinking POC with warming than default (black), while adding ECO (yellow) leads to less sinking POC with warming (and adding both [pink] gives a smaller decline in sinking POC than default).
We find that turning on just temperature-dependent remineralisation (TDR) increases cumulative POC export relative to default runs (+∼1.3 %) as a result of increased nutrient recycling from remineralisation occurring closer to the surface with warming, whereas turning on just trait-based ecology (ECO) decreases cumulative POC export (−∼0.9 %) by enabling a shift to smaller plankton which produce less sinking POC.
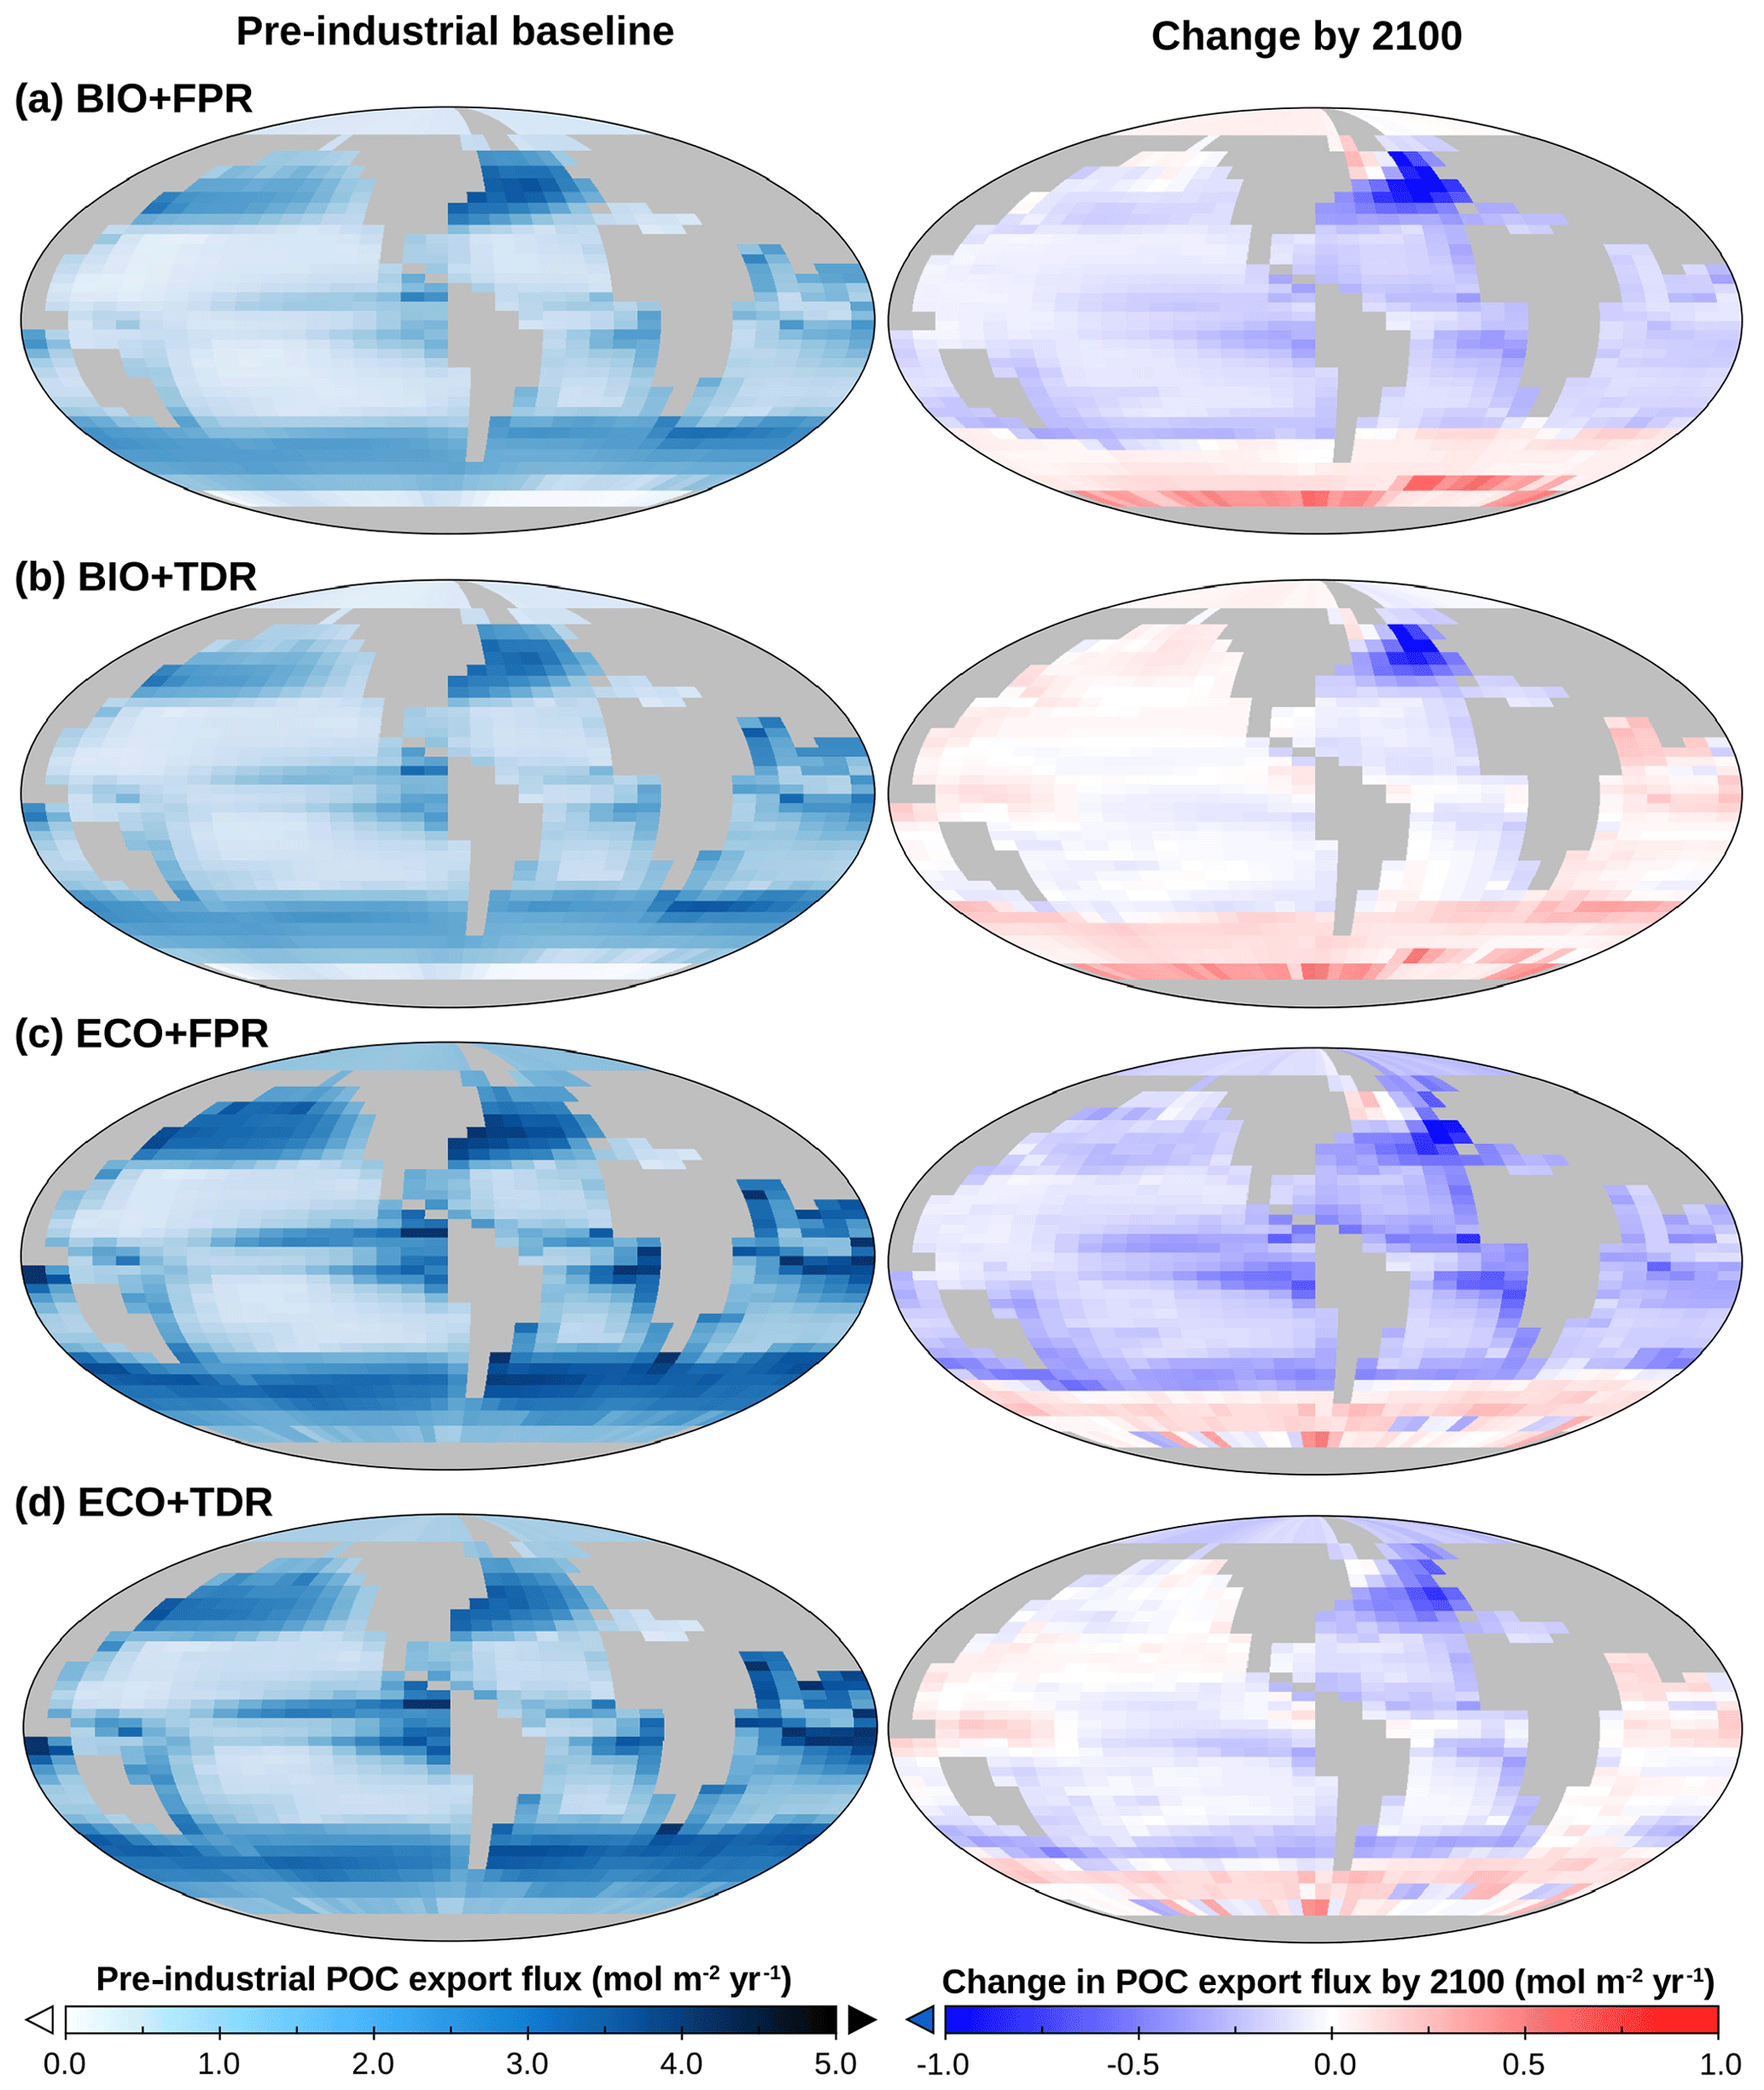
EcoGEnIE POC export maps for default calibration model runs, showing baseline export patterns (left) and the change in POC export by 2100 relative to the 1765 pre-industrial baseline as a result of RCP4.5 (right). Darker colours on the left indicate areas where more POC sinks from the surface ocean (i.e. a stronger biological pump). On the right, blue areas show where sinking POC decreases with warming, while red areas show where it increases. In general, adding TDR means a smaller decline in sinking POC in non-polar oceans, while adding ECO means a greater decline.
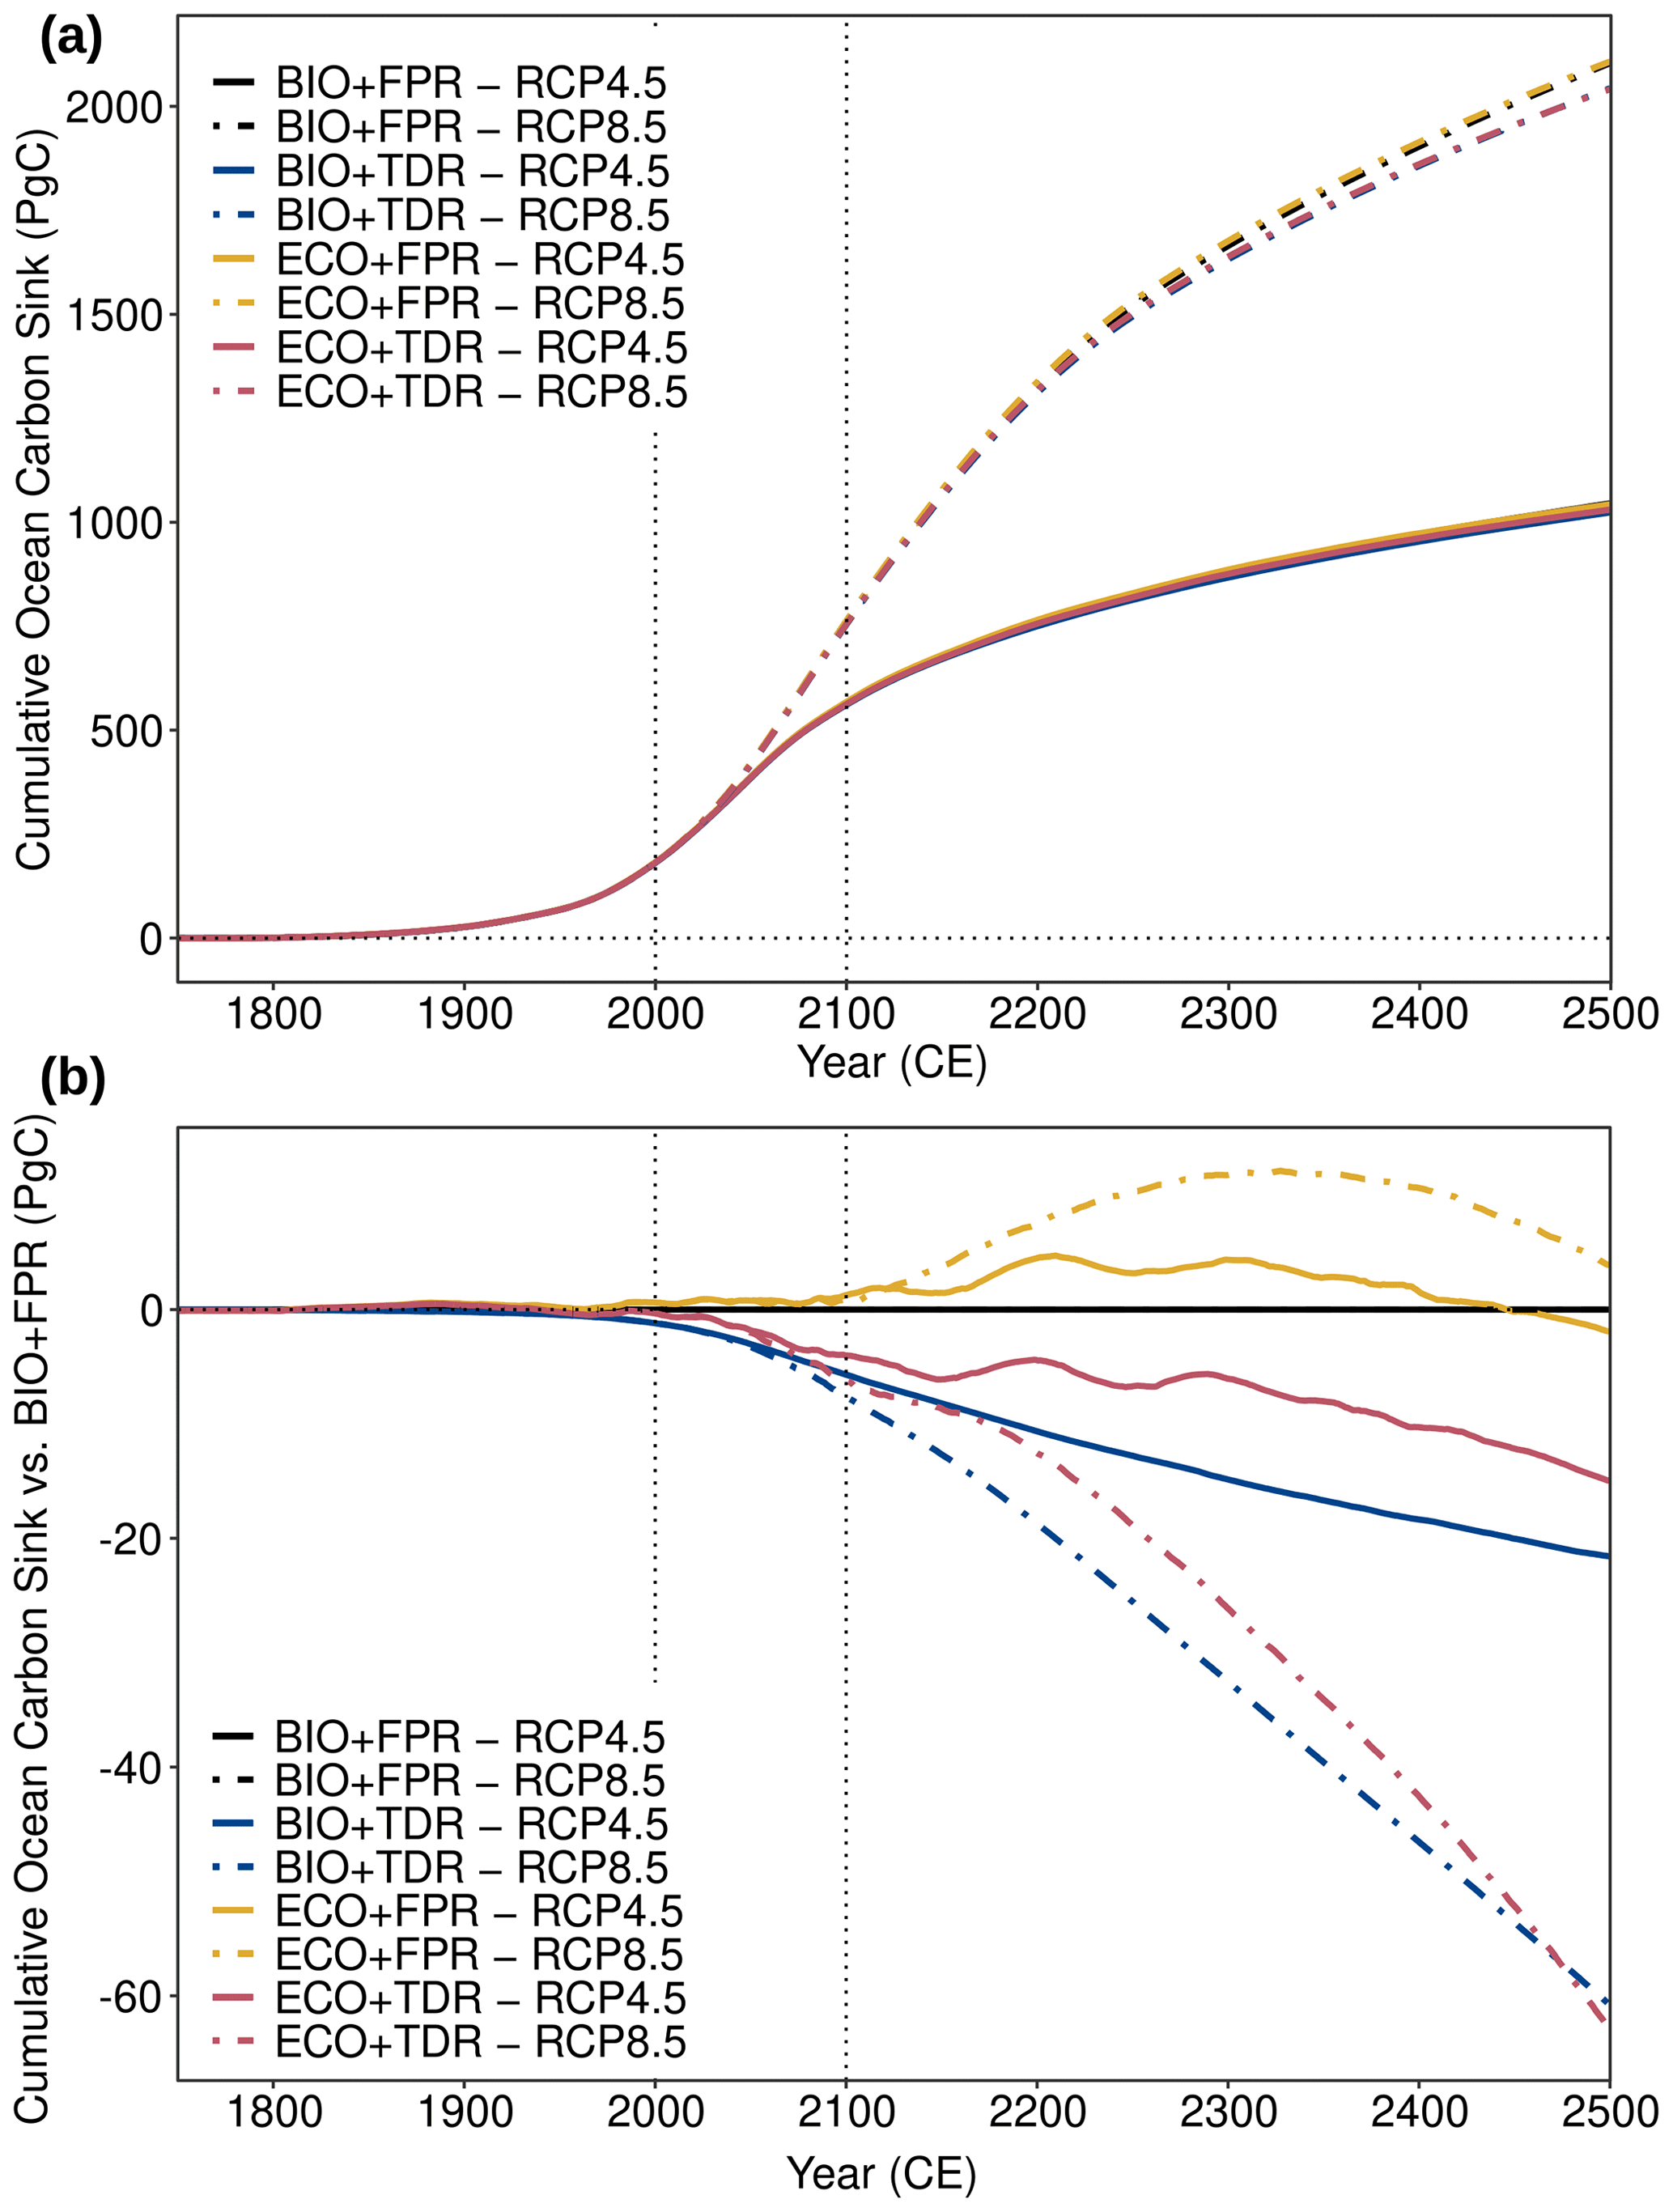
In contrast, interactions with complex surface carbonate chemistry and ocean acidification cause opposite responses for the ocean carbon sink in both cases: activating temperature-dependent remineralisation (TDR) leads to a smaller sink relative to default runs (−∼1.0 %), whereas activating trait-based ecology (ECO) leads to a larger relative sink (+∼0.2 %).
Graphs showing ecoGEnIE simulation results for the absolute cumulative ocean carbon sink and the cumulative ocean carbon sink relative to BIO+FPR under different configurations and forcing scenarios.The bottom plot better shows the differences between the configurations – from the left-to-right, going above the zero-line (which represents the default model without the new features) means the ocean carbon sink is bigger in the new model configuration than the default configuration, while going below the zero-line means it’s smaller than the default configuration. In general adding ECO (yellow) leads to a bigger ocean carbon sink with warming, while adding TDR (blue) or combining ECO & TDR (pink) leads to a smaller sink.with warming
Down the sink
Combining both temperature-dependent remineralisation (TDR) and trait-based ecology (ECO) results in an overall strengthening of POC export (+∼0.1 %) and an overall reduction in the ocean carbon sink (−∼0.7 %) relative to default runs. Around 6 gigatonnes less carbon is taken up by the ocean in the 21st century as a result – a bit under 1 year of current human emissions.
This isn’t a huge difference, but is still more than current Earth system models project. There are also other important ecological processes not yet in the model (e.g. separated plankton shell types, ballasting, low resolution) that future work will need to look at to refine these estimates.
These results illustrate though the degree to which ecological dynamics & biodiversity modulate biological pump strength, and indicate that incorporating ecological complexity in Earth system models allows them to more fully resolve non-linear climate–biosphere feedbacks.
With thanks to co-authors Sarah Cornell, Katherine Richardson, and Johan Rockström, and the ERC-funded Earth Resilience in the Anthropocene (ERA) project for supporting this work during my postdoc at SRC!
Much like buses, after a waiting a while for new papers to be published two have come along in short succession. This time though we’re back in the palaeoclimate domain, with a paper based on my work on a ReCoVER-funded Early Career Research award hosted at Ocean & Earth Science at Southampton which applied ‘early warning signal’ methodology to Cenozoic palaeoclimate records. It’s now available open access from Climates of the Past, and as with other papers I’ll summarise it here on my blog as well.
My first EGU journals paper , and a pleasant public review process!
The setting of this paper is the Palaeocene-Eocene Thermal Maximum (i.e. the PETM), which is a natural case of carbon cycle disruption and linked rapid global warming that happened about 56 million years (My) ago. The triggers of this event are still being investigated, but palaeorecords point to the release of several thousand gigatonnes of carbon being released over a few thousand years driving ~5oC of global warming. As a comparison to today, this is a similar amount of carbon as humans are likely to emit from fossil fuel burning but over ~10 times the time, making it a partial but limited analogue to current climate change. The PETM was then followed by several smaller ‘hyperthermal’ events on a regular timescale into the warm Eocene.
As with many other big ancient climate shifts, the PETM was preceded by more gradual changes before a rapid shift, which has led many to hypothesise that it involved some sort of ‘tipping point’ (i.e. when gradual changes can eventually lead to a sudden shift in a system after reaching a critical threshold – see climatetippingpoints.info for more info!) that led to lots of carbon from parts of the Earth system like methane hydrates or peat being suddenly released. Alternatively, the PETM also coincided with a time of mass volcanism associated with the opening of the North Atlantic (of which Iceland is now the distant hangover of), and so could have been directly triggered by volcanic eruptions without any sort of tipping point involved.
Theory suggests that tipping points are often preceded by small but detectable ‘early warning signals’ (EWS), which can be found using statistical analysis of data. After an early proliferation of EWS techniques a few years ago though researchers have found them to have important limitations, with data quality being a big constraint and a propensity for false or missed alarms. Despite this, using multiple EWS indicators of different types along with strong statistical significance testing can still give us a pretty good idea of changes in a system’s overall resilience, with increasing variability and system ‘memory’ indicating the weakening of the system’s stabilising negative feedbacks and therefore a greater risk of being disturbed.
In our study we put this to the test by analysing some good quality long palaeorecords covering 5 My before the PETM and ~2 My after in order to look for any significant changes in carbon-climate system resilience that might help explain the origins of the PETM. We found consistent evidence from several different methods of a gradual destabilisation of the geological carbon cycle in the ~2 My before the PETM, and long-lasting carbon-climate system instability in the aftermath. This period coincides with the North Atlantic volcanism, leading us to suggest that these eruptions helped to gradually destabilise the carbon cycle by suppressing organic carbon burial (in particular either the marine biological pump or peat on land) as the result of volcanism-driven warming .
However, although this could mean the PETM itself was a tipping point resulting from this destabilisation it cannot solidly prove it, and we find no evidence of a tipping point in just the climate system either. Despite this, a decline in carbon cycle resilience would’ve still made it easier for the PETM to occur and last longer than it would’ve been otherwise, as weaker negative feedbacks would slow down the carbon cycle’s recovery to pre-PETM conditions. We also find evidence that the subsequent hyperthermal was preceded by slightly different dynamics than the PETM itself, which fits with the hypothesis that the PETM required an extra “push” from say volcanism but that the later events were more traditional tipping points.
To find out more, the full article is open access and free to read for all, and direct questions are welcome. Future follow-up work include a similar analysis of the Cretaceous/Palaeogene boundary and the Deccan Traps (paper TBC), and other Cenozoic climate shifts as more long and high-resolution records become available. Thanks also go to EPSRC/ReCoVER for funding the initial project, OES at Uni. Southampton for hosting the project back in Summer 2016, SRC where I did the final revisions/reanalyses, and Stockholm University for funding the open access publication.
I’ve had a paper accepted over at Science of the Total Environment called “To what extent has sustainable intensification in England been achieved?” – click here for free access to the final published version (open until 18/19/2018), and after that you can find a free pdf of the accepted post-print manuscript over on my publications page. This is the final product of the first postdoc I took on at Southampton’s Geography department in 2015-16, so it’s good to see it finally out there! It’s also my first paper branching out into Sustainability Science & Socio-Ecological Systems from my Geological/Earth System roots. Here’s a blog summary:
The background to the paper is the drive for the Sustainable Intensification of Agriculture (SI) – the goal being to produce more food with a smaller environmental footprint, as agriculture remains one of the biggest global drivers environmental degradation while global population is projected to substantially grow by mid-century. This has been a hot topic over the last couple of decades in agricultural & environmental sciences, and there’s evidence for some progress in some places. However, the process of SI itself is not sufficient if the environmental footprint is still too big to be truly sustainable – we need to make sure that SI leads to global and regional agroecosystems reaching a ‘safe operating space‘ in which no ecosystem service is degraded beyond acceptable planetary/regional boundaries. In other words, making intensification a bit more sustainable or efficient isn’t enough if the environment that agriculture depends on is still being degraded in some way.
In this study we used publicly available data to determine the progress of SI in England and two sub-regions (mostly arable Eastern England & mostly pastoral South-Western England), using it as a case study of a rich, developed country with some signs of SI occurring. We use the data to produce metrics and indices of various important ecosystem services important for keeping the English agroecosystem in a safe operating space, such as river contamination by agricultural nutrients (water quality), atmospheric emissions (air quality), the farmland bird index (proxy for wider biodiversity), and soil erosion, as well as how much food is produced (wheat yield, and meat & dairy) and socio-economic context (e.g. farm income, subsidies, labour, etc.). [It’s worth noting here that even in a rich country there are some things we just couldn’t get enough data for, making this only a partial analysis]. From this we looked at their relative trends, performed some statistical analyses to explore these trends, and then built a simple system dynamics model of the agroecosystem and make some future projections.
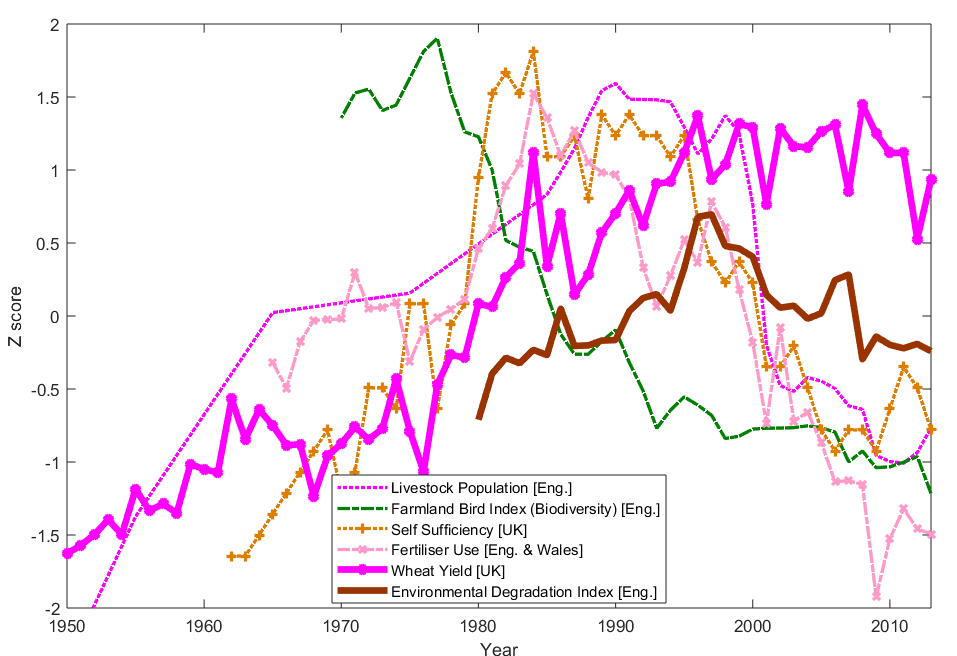
Here’s a key summary figure of our main results (from the graphical abstract to the paper):
Graphical Abstract from Armstrong McKay et al. (2018) showing some key intensification trends in the English agroecosystem between 1950 and 2013.
The trends above (shown as z scores, i.e. relative changes rather than the absolute values) can be split into two main phases. Prior to the mid 1990s, Wheat Yield increases as a result of conventional Agricultural Intensification driven by increased fertiliser use, with livestock population and outputs also increasing. This results in greater food self-sufficiency (i.e. less food imported), but also leads to increased environmental degradation (the thick brown line) primarily due to pollution and falling farmland biodiversity (the dot-dashed green line). However, after the mid 1990s fertiliser use decouples from yield and starts to fall (while yield stays stable), which along with falling livestock population (mostly due to the 2001 foot-and-mouth disease outbreak) leads to a fall in pollution and therefore in overall degradation.
This seems like good news, and it partially is (especially for river-water and air quality, the biggest improvers), but this fall in overall degradation masks the fact that farmland biodiversity fails to recover at all. The parallel decline in self-sufficiency also means more food is being imported to the UK, and indicates that some of the UK’s agricultural degradation is simply being ‘offshored’ to other countries to deal with instead. These trends were further analysed and confirmed by the statistical analyses and modelling, and can also be plotted against GDP per capita to show a partial ‘Environmental Kuznets Curve’ (a reduction in degradation relative to yield beyond a certain level of prosperity – implying that prosperity leads to less degradation – but critically not for biodiversity, and could also be the result of using prosperity to pay others to degrade instead). Another interesting outcome from the analysis is the despite there being some evidence of ‘land sparing’ – i.e. intensification allowing the transfer of marginal agricultural land to conservation areas, here primarily from rough grazing areas – this has not stopped biodiversity decline so far despite being mooted as a key conservation strategy (see the paper for thoughts as to why).
Overall, these trends indicate that SI has indeed begun in England, but with major negative trade-offs on biodiversity and offshored degradation. These trade-offs undermine the general SI trend, and so must be dealt with before the English agroecosystem can reach a safe, or just, operating space. In future there’ll also be the challenges of climate change (which is likely to reduce yields and biodiversity overall) and post-Brexit subsidy changes (which might affect the financial viability of farming), which will require even more SI to counteract. What this future SI will look like is hard to say, but it’ll certainly require new approaches to subsidies and agri-environment schemes that better encourage both biodiversity restoration and reduced offshoring of degradation.
For more details, go read the paper and feel free to ask me questions!
Some big (and late) news from me: as of this April and after ~10 years I’ve finally left Southampton to move to Sweden for a new Post-Doc (along with my partner Rachael – see her blogs about moving to Sweden)!
The last time I posted on this blog I had just started a new Post-Doc project in Southampton – since then I moved on to a new project (using Agent-Based Models to design agroecological microinsurance co-ops to improve the resilience of smallholders in coastal Bangladesh) and have now taken up a new Post-Doc at Stockholm Resilience Centre (a cutting-edge research institute within Stockholm University promoting ‘Sustainability Science for Biosphere Stewardship’). I’ll be working on modelling nonlinear climate-biosphere feedbacks as part of the Earth Resilience in the Anthropocene project for the next 2 years – you can find some more details at my SRC bio or on my newly updated Research pages. It’s also nice to have a longer project to get my teeth into compared to the rather short-term and precarious small pots of funding I’ve had since the end of my PhD – ~2 guaranteed years of job and housing seems like quite the luxury compared to the uncertainty of the last few years! We’ll be living in Solna in Stockholm county for the duration, and I’m hoping to get out and about exploring around the Nordic/Baltic regions and getting some good travelling and bushcrafting in.
Things continue to keep rapidly changing this year, and I’ve started on another new academic project!
Back in May I started a new Post-Doc Research Fellowship in the Global Environmental Change and Earth Observation group in the Geography and Environment dept. of the University of Southampton, working on the ReCoVER Network-funded pilot study project “Agent-based models for the analysis of early warning signals of ecosystem tipping points” with PI James G. Dyke. In this project we’re working on some new potential early warning signals for ecosystems near tipping points – in particular looking at the ecosystems’ compositional disorder and food web dynamics and replicating these using Agent Based Models (ABMs) – using lake eutrophication as a case study. We’re hoping this 6 month pilot study will lead to some new useful metrics for detecting potential tipping points in ecosystems (and socio-ecological systems) developed through a bigger project in future. Thanks again to the ReCoVER Network for funding this project! This means I’ll still be In Southampton for the rest of 2017, but beyond that who knows…
In other news, I’ll be giving a Winchester Café Scientifique talk on Monday 4th September about Climate Tipping Points (linked to my http://www.climatetippingpoints.info outreach project) – I’ll be talking about what climate tipping points are, how they might affect us, and whether we can predict them, as well as considering how they make climate change more of a “wicked problem” to deal with. Come along if you’re around!
My ReCoVER-funded outreach project on Climate Tipping Points has mostly come to an end now, and it’s gone really well. We’ve done some public events including a school science day and some public conversation sessions, and I’ve written a collection of articles over at www.climatetippingpoints.info and an article for The Science Room responding to their community question of “Why is Climate Change so Hard to Address?” (also posted over at my new Medium page where I’ll try to post my non-academic writing). We’ve also made an animated guide to Climate Tipping Points, with thanks going to Rachael for lending us her voice and Ciarán for animating:
There’ll also soon be a podcast chat with my friend Jess on the same material too, alas featuring my own voice instead of Rachael’s (and it turns out the only way to make my voice sound more posh is for me try and sound less posh…).
Since I last posted I’ve also moved on to a new Postdoc based at Geography at the University of Southampton with Prof. John Dearing, once again moving from ancient climate change to modern sustainability to study macroscale controls on how Ecosystem Services and Poverty Alleviation are interlinked. This position has been intense and led to some interesting outcomes (paper now in progress) but as another short contract is now nearly finished, so the hunt for a new position continues!
I’m pleased to announce that I’ve been giving funding by the ReCoVER network to do some Outreach linked to the end of my current Research Fellowship, and so we’re now launching the project: “The Point of No Return? An Interactive Stall and Website Starting Conversations on Climate Tipping Points”.
In this project we’ll be hosting conversations about climate tipping points at a series of stalls, public discussions, and online during October and November 2016, focusing on how they happen, why they’re important to our lives, and how researchers are trying to understand and predict them.
We’ll be running stalls at Southampton Sustainability Week (8th-16th October) – including at the Family Festival of Science at Thomas Hardye School on October 8th (tomorrow!) and at Researchers Café at Mettricks on October 14th – and at TEDx Southampton (5th November). We’ll upload materials from the stall on the website along with additional articles, blog posts, interactive discussions, integrated social media feeds, a podcast, and videos (in collaboration with local film-maker global documentary and a local animator) about climate tipping points.
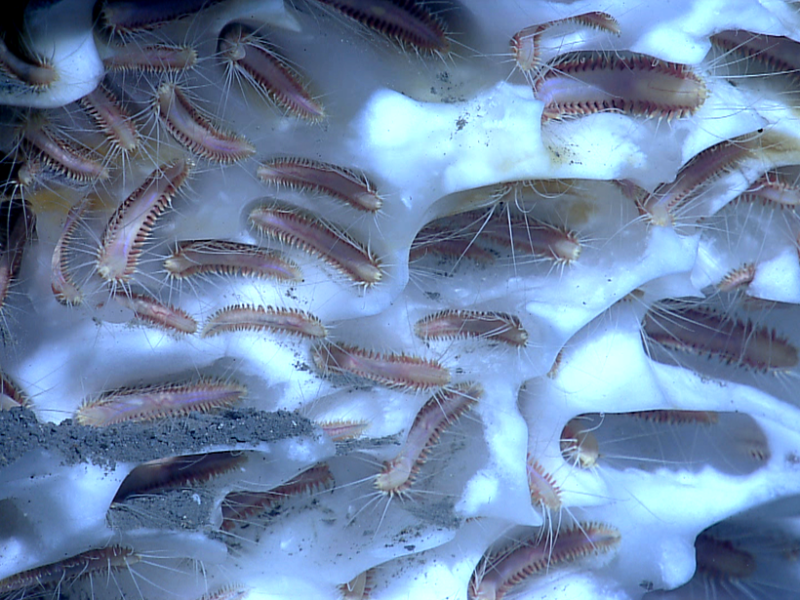
Deep-sea worms living in methane hydrates in the Gulf of Mexico (that Eos used to illustrate its article on our paper) [credit: NOAA Okeanos Explorer Program, Gulf of Mexico 2012 Expedition,CC BY 2.0]Earlier this week a paper I co-authored – in which we use geophysical models of methane hydrates to work out how quickly they may have dissociated and escaped into the ocean during the Palaeocene Eocene Thermal Maximum (PETM) ~56 million years ago – was published over at Geophysical Research Letters and featured as a Research Spotlight by AGU’s Eos.
The latter does a good job summarising it for those without access to the article (though if you’re on Researchgate you can find an Open Access version), but to summarise in my own words here our results suggest that while hydrates could rapidly dissociate during the rapid warming of PETM, it’s difficult to get that methane out as quickly as it gets trapped in sediment pores on the way up (where it can also get eaten by microbes). For lots of methane to make it to the ocean there either needs to have been a lot more hydrate deposits in the late Palaeocene than we thought (which may be unlikely in the warmer oceans of back then), or cracks and fissures may have played a key role in allowing the methane to seep out. Without either of these it becomes quite challenging to explain the big carbon cycle disruption seen in the palaeorecord at the PETM using methane hydrates as the primary driver alone.
This is not to say that we’re safe from methane hydrates now though*, as global warming today is proceeding far faster than at the PETM. During the PETM temperatures rose roughly 5 degrees celsius over 1000 to 10,000 years, whereas today we’ve already pushed up temperatures 1 degree over the last century and could hit 5 degrees in total in another century-plus in a no-holds-barred scenario. More rapid warming could induce a different dissociation to release ratio this time round, and if pressure-induced cracks did play a role in letting methane escape during the PETM then this could be important in projecting how methane is released from hydrates in the coming centuries. Of course, these are good places for further research – just how much escaped in the past, and how might very rapid warming affect this?
~
*I noticed our research was picked up by Breitbart.com – not known for accurate reporting on climate issues – presumably because it might look like we’re weakening a prehistorical example of carbon-induced climate change. Of course, there’s still a massive carbon release event recorded simultaneously with warming during the PETM which our work does nothing to weaken, and as explained above it’s not an ideal comparison for the future anyway due to differing warming rates.